I was working on a project and I needed a quick randomized data of an existing dataset. However, I don’t need it to be just randomized. I also want it to be randomly correlated with a selected variable. Why? Because I needed a practice file to work on regression models and there should be some correlation to be able to work on more realistic way.
I searched a little, couldn’t find a “plug&play” method. (Maybe I wasn’t looking to the right place.)
So, I created this example code set to give an idea about how to do it quickly and in a relatively efficient way. I hope this helps to somebody!
2 Libraries to Use
Hide / show the code
# Setting the Working directory---------------------------------------------WorkingDirectory <-getwd() # IF you saved the file, this gets the file pathif (!is.null(WorkingDirectory)) setwd(WorkingDirectory)# Loading the libraries-----------------------------------------------------if (!require("pacman")) install.packages("pacman")
Loading required package: pacman
Hide / show the code
p_load(pacman, # if you have a missing library, pacman will find and install!
       GGally, # to create a correlation plot
       MASS, # to get the example dataset called Boston
       openxlsx, # creating the excel outputs
       tidyverse  # for just many things :)
       )
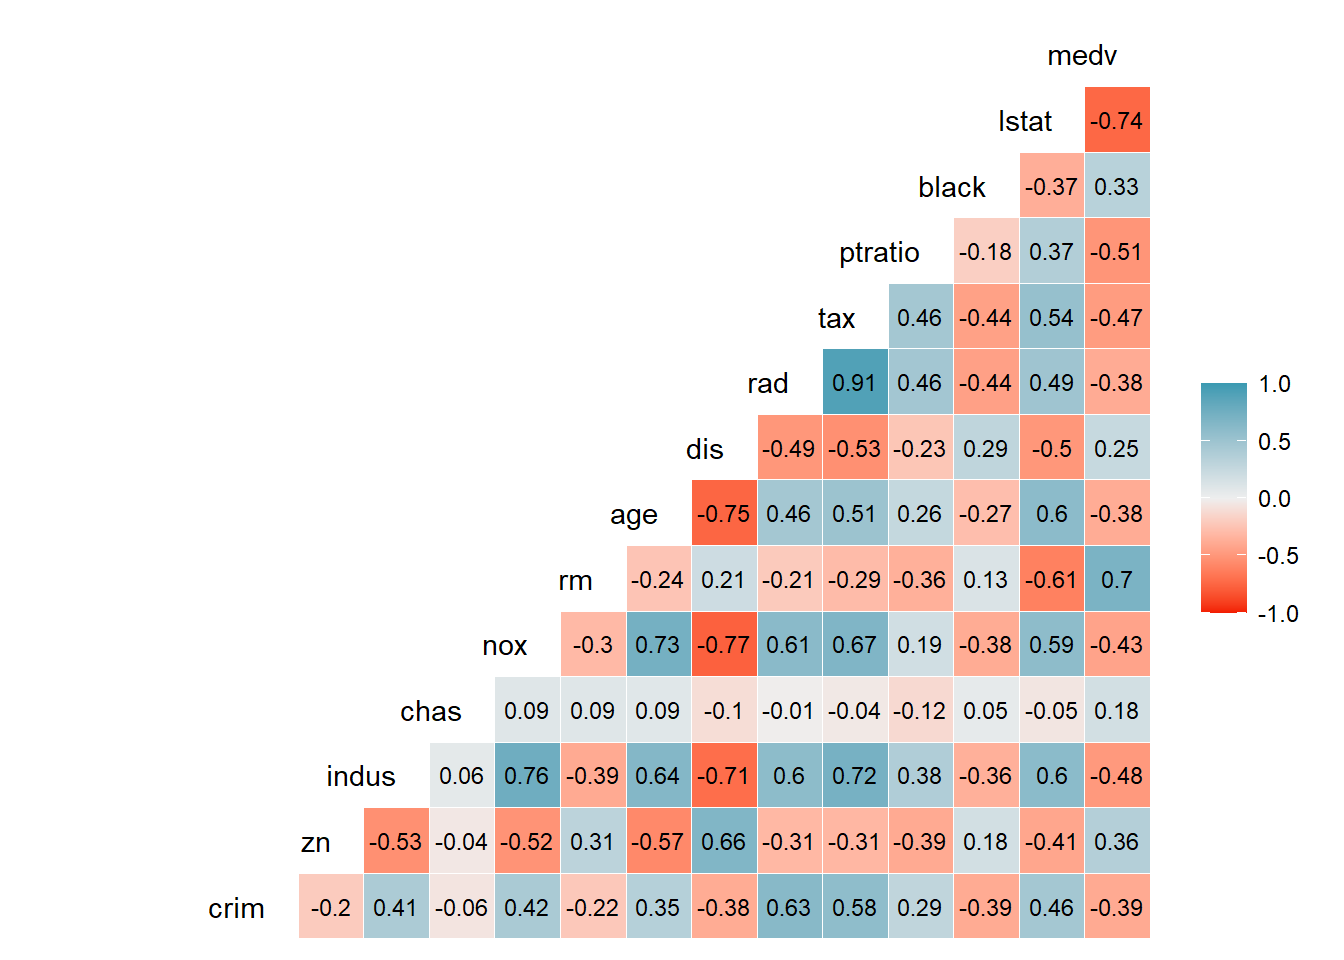
Let’s have a look to the heat map of current correlations between each variable:
Hide / show the code
# Creating a correlation model with categorical variables also taken into accountcorr_model_matrix<-model.matrix(~., data=dataset.df) # Creating a correlation plotggcorr(data= corr_model_matrix[,-1], label = T, label_round=2,hjust =1, digits =2, layout.exp =3,label_size =3,low="#F21A00",high="#3B9AB2" )
4 Randomizing Process
When you need “repeatability” in your project, you can set the seed with the code below but I’m not going to use it, I just need randomness. Putting here just in case you need:
Hide / show the code
# Set seed for reproducibility (only if you want to replicate the operation)# set.seed(42)
Our strategy will be as simple as possible: To make the randomizing, we will use existing values of each variable and apply add/subtract of some numbers to them. These numbers which are to be added or subtracted will be related to standard deviation of each variable we are applying. In addition, we will put another add/subtract operation with random weight and this time, we will also use the standard deviation of our response (dependent) variable.
Let’s see how this work in action.
1- We need some weights for each variable which are randomly created. Then we will use these weights to change the variables on minus or plus side. We are putting “-1” because we will need 1 weight value for each variable except the dependent variable which we will not touch.
Hide / show the code
weights <-rnorm(ncol(Boston) -1)
2- We also need some Gaussian (normal distribution) noise to add to each variable. To do that, instead of using a fixed number, I also create options between 0.1 to 0.6 and randomly select one of them in each run. Additionally, I’m creating a copy of original data as “randomized_dataset” to alter it after and dataset dimensions to use after.
Hide / show the code
randomized_noise_options <-seq(0.3, 1, by =0.1)noise_level <-sample(randomized_noise_options, 1, replace =TRUE)randomized_dataset.df <- dataset.dfncols <-ncol(dataset.df) # number of columns in the datasetnrows <-nrow(dataset.df) # number of rows in the dataset
3- In a for loop, we need to run over each variable, replacing them with altered versions.
Hide / show the code
for (i in1:(ncols -1)) { # Iterate over columns except the response(medv)if (names(dataset.df)[i] !="medv") { # if medv comes,code skips it randomized_dataset.df[[i]] <- randomized_dataset.df[[i]] +# taking the current value then start to add noise# Create Gaussian noise with each variables own std. dev. weights[i] *rnorm( nrows, #number of random points needed mean =0, # zero mean for centered noisesd = noise_level *sd(dataset.df[[i]])) +# And weighted randomness to add by using medv's sd weights[i] *rnorm(nrows, 0, noise_level *sd(dataset.df[["medv"]])) }}
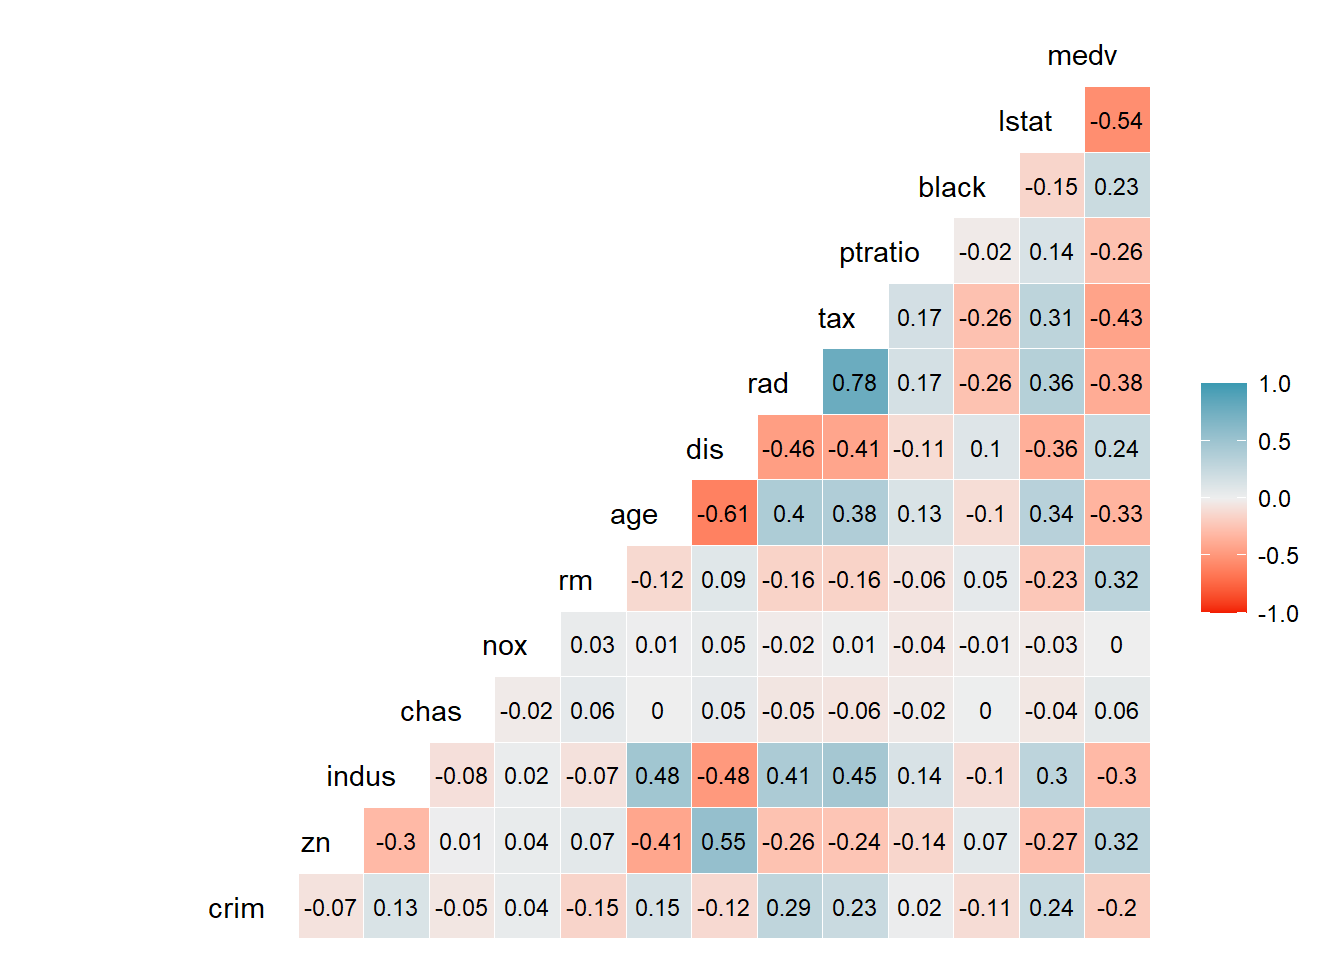
4- Now if we check the correlations, we will see a different result but still some correlations with medv:
Hide / show the code
# Creating a correlation model with categorical variables also taken into accountcorr_model_matrix<-model.matrix(~., data=randomized_dataset.df) # Creating a correlation plotggcorr(data= corr_model_matrix[,-1], label = T, label_round=2,hjust =1, digits =2, layout.exp =3,label_size =3,low="#F21A00",high="#3B9AB2" )
If you will take all the code until here and run, each time you run it, it will not only change the original dataset without destroying all the correlations, but also randomize the correlations and correlated variables.
5 Assemble the Pieces
Now the last step is to merge all the code and create the desired number of excel outputs.
Let’s say we need 30 different randomized Boston datasets and needed them exported as excel files. So, I created a variable to control how many outputs will be generated.
Hide / show the code
# Define the number of randomized datasets to createnum_datasets <-30
After, we can assemble all the code together:
Hide / show the code
# Setting the Working directory---------------------------------------------WorkingDirectory <-getwd() # IF you saved the file, this gets the file pathif (!is.null(WorkingDirectory)) setwd(WorkingDirectory)# Loading the libraries-----------------------------------------------------if (!require("pacman")) install.packages("pacman")p_load(pacman, # if you have a missing library, pacman will find and install! GGally, # to create a correlation plot MASS, # to get the example dataset called Boston openxlsx, # creating the excel outputs tidyverse # for just many things :) )# Load the Boston housing datasetdataset.df <- Boston# Set seed for reproducibility (only if you want to replicate the operation)# set.seed(123) # I commented here, because the idea is the randomizing.# Define the number of randomized datasets to createnum_datasets <-30# Prepare the column and row number variables to use afterncols <-ncol(dataset.df) -1# number of columns to changenrows <-nrow(dataset.df) # number of rows in each variable# Loop through the dataset defined times and create randomized versionsfor (i in1:num_datasets) {# Create a copy of the Boston dataset randomized_dataset.df <- dataset.df# Randomizing the noise level and weights randomized_noise_options <-seq(0.1, 0.6, by =0.1) noise_level <-sample(randomized_noise_options, 1, replace =TRUE) weights <-rnorm(ncols)for (j in1:ncols) {if (names(randomized_dataset.df)[j] !="medv") {# taking the current value then start to add noise randomized_dataset.df[[j]] <- randomized_dataset.df[[j]] +# Create Gaussian noise with each variables own std. dev.rnorm(nrows, mean=0, sd = noise_level *sd(dataset.df[[j]])) +# And weighted randomness to add by using medv's sd weights[j] *rnorm(nrow(randomized_dataset.df), mean=0, sd= noise_level *sd(dataset.df[["medv"]])) } }# Save the randomized dataset as an Excel file filename <-paste0("Boston_Randomized_", i, ".xlsx")write.xlsx(randomized_dataset.df, file = filename, rowNames =FALSE)}
Et voila!
6 Conclusion
This is just one way to do this. There could be other ways or may be dedicated packages but I don’t know them yet. For the moment, this solved my issue and I hope solves yours, too.