What to Expect
In the end of this article, you will be able to:
- Create a data source using Python or R for Power BI.
- Create visuals using Python or R libraries and functionality
The “why”
First of all, if you have never touched Python or R before and have no interest in learning at least basic Python or R, this article may not be interesting for you. Yet, if you are a ML developer or Data Analyst, you can leverage the power of Power BI with your current skills. OR, if you are a Power BI developer and searching some area to expand your skills, this could be a good bridge.
Place of R and Python in Power BI
I would like to summarize what you can do with R and Python in Power BI in general:
Python and R as DATA SOURCE: You can manipulate, clean, summarize etc. your data with Python and R, and leave the visualization to Power BI.
Python and R as Data Viz Tool: Maybe you want to create a cool 3D chart with plotly in Power BI but Power BI doesn’t have such a tool. Python and R can help about this!
Reasons to Choose This Path
Let me give you some good reasons to use Python in Power BI as below:
Advanced Data Analysis: Python and R are a powerful programming languages with numerous libraries and packages that enable advanced data analysis, statistical modeling, and machine learning. By integrating Python and R scripts into Power BI, you can leverage the full potential of these languages.
Custom Data Transformations: These languages allow you to perform custom data transformations using your preferred libraries, which can be especially useful when dealing with complex data cleaning and preparation tasks.
Machine Learning: Both Python and R have a rich ecosystem of machine learning libraries. Integrating these libraries with Power BI allows you to build and deploy machine learning models directly within your reports or dashboards.
Visualizations: While Power BI provides a wide range of built-in visualizations, Python’s visualization libraries, like Matplotlib and Seaborn, or R’s ggplot and plotly, offer additional customization and flexibility in creating unique and interactive charts and plots.
External Data Sources: Python and R can connect to various external data sources, APIs, and web services that may not be directly supported by Power BI.
Forecasting and Time Series Analysis: Python and R have excellent time series analysis and forecasting libraries. You can leverage these libraries to create accurate predictions and visualize forecasted data within Power BI.
Data Science Pipelines: Python and R allow you to create end-to-end data science pipelines, including data cleaning, feature engineering, model training, and deployment. You can integrate these pipelines with Power BI to automate data processing and analytics tasks.
The “how”
Before going further:
R and/or Python must be installed on your computer.
Required libraries for your data manipulation, data reading or visualization must be installed on R and/or Python. (e.g.
matplotlib,seaborn,pandas,numpyfor Python,readr,dplyr,ggplotfor R.)
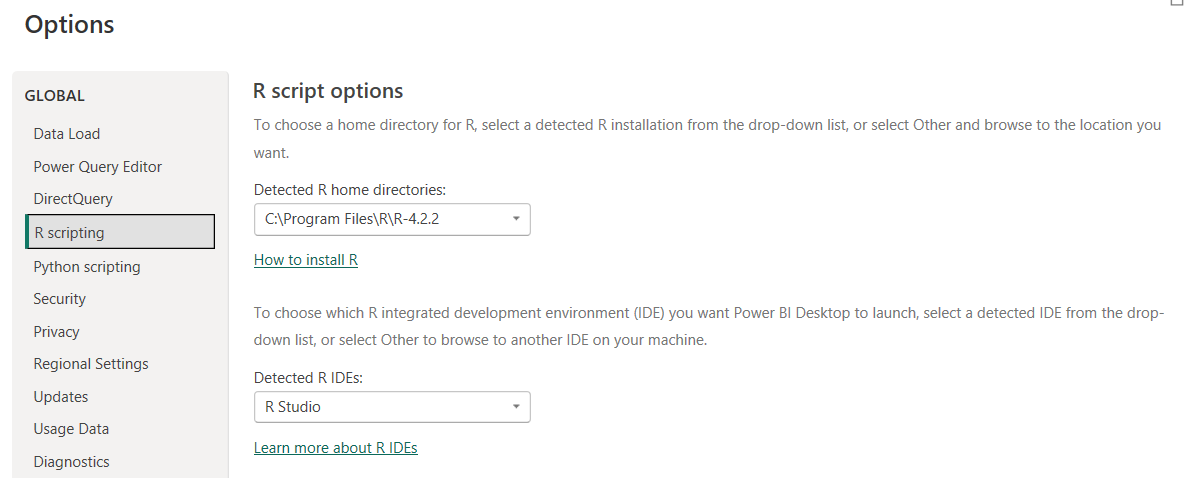
Enabling R in Power BI
Go to Options in Power BI and select the home directory and IDE for R as the example below:
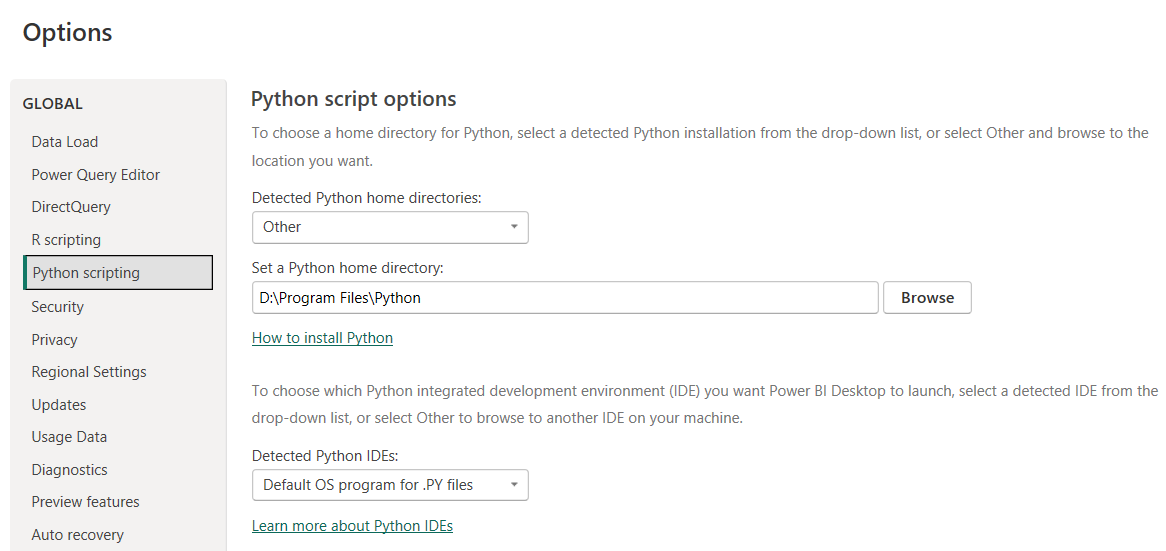
Enabling Python in Power BI
Like R, go to the Options in Power BI and select the home directory and IDE for Python as the example below:
Testing the Connection
When you click OK, actually Power BI doesn’t bother to check if the connection really works or not. 😒🤷♂️
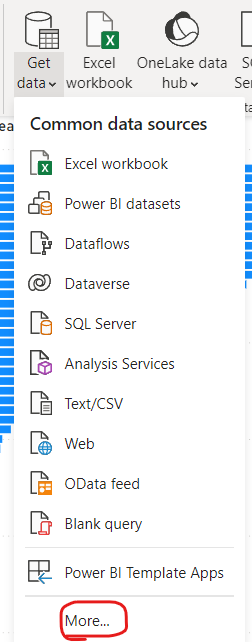
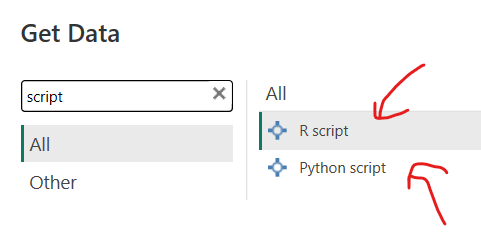
So, like you always do when you are defining a data source, just go to:
- get data -> more -> Python or R Script
After you get, just copy paste the below codes for Python or R respectively:
For Python:
import pandas as pd
df = pd.DataFrame({
'Fname':['Harry','Sally','Paul','Abe','June','Mike','Tom'],
'Age':[21,34,42,18,24,80,22],
'Weight': [180, 130, 200, 140, 176, 142, 210],
'Gender':['M','F','M','M','F',, 'M','M']
})
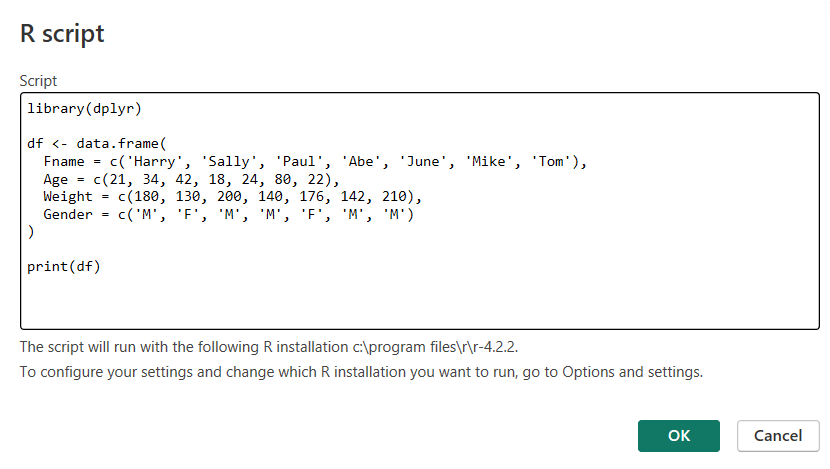
print (df)For R:
library(dplyr)

df <- data.frame(
  Fname = c('Harry', 'Sally', 'Paul', 'Abe', 'June', 'Mike', 'Tom'),
  Age = c(21, 34, 42, 18, 24, 80, 22),
  Weight = c(180, 130, 200, 140, 176, 142, 210),
  Gender = c('M', 'F', 'M', 'M', 'F', 'M', 'M')
)

print(df)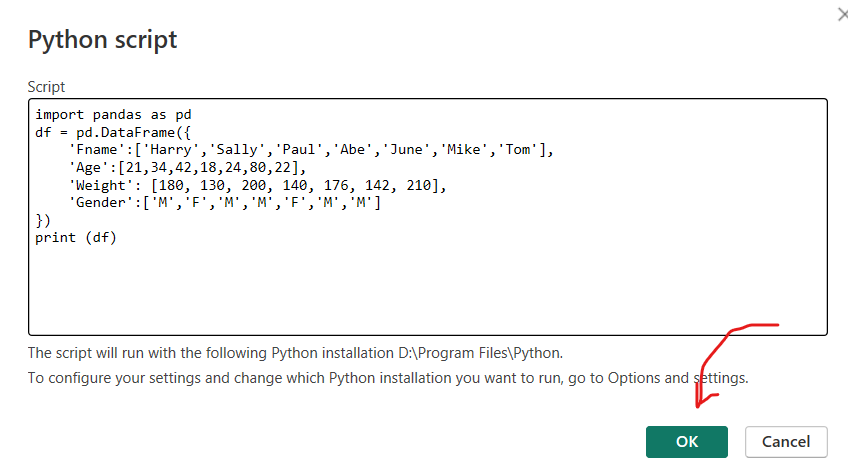
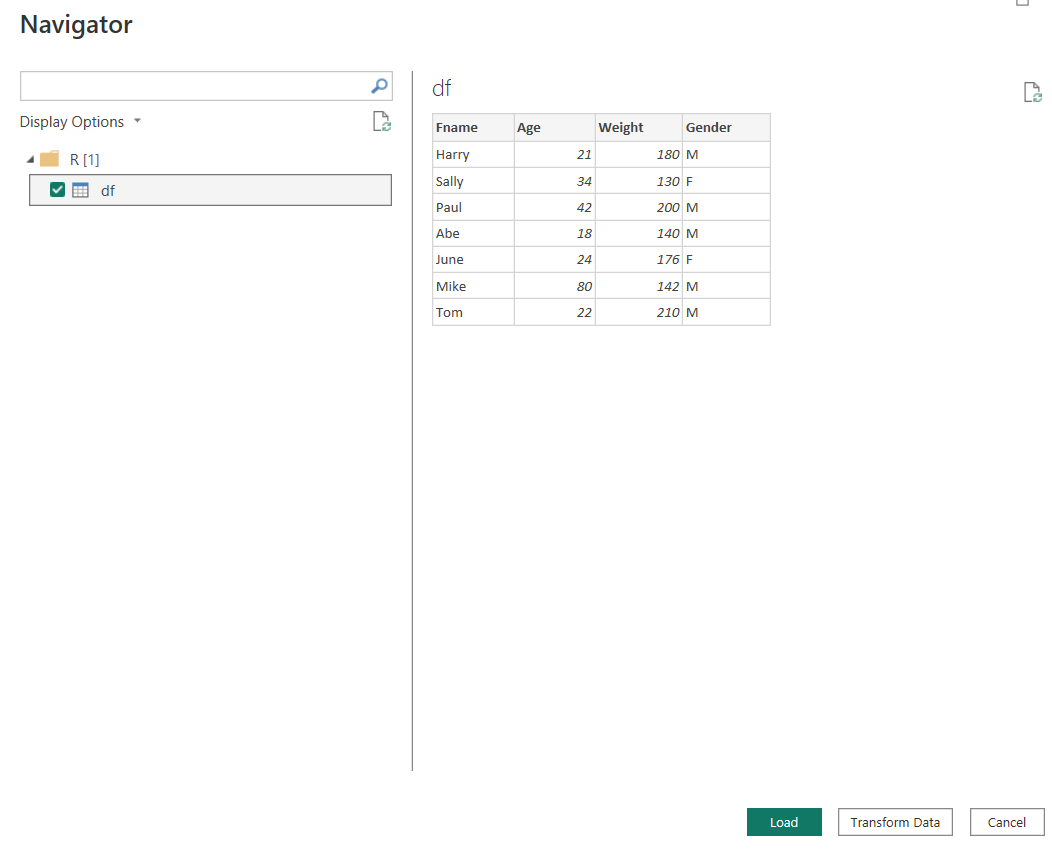
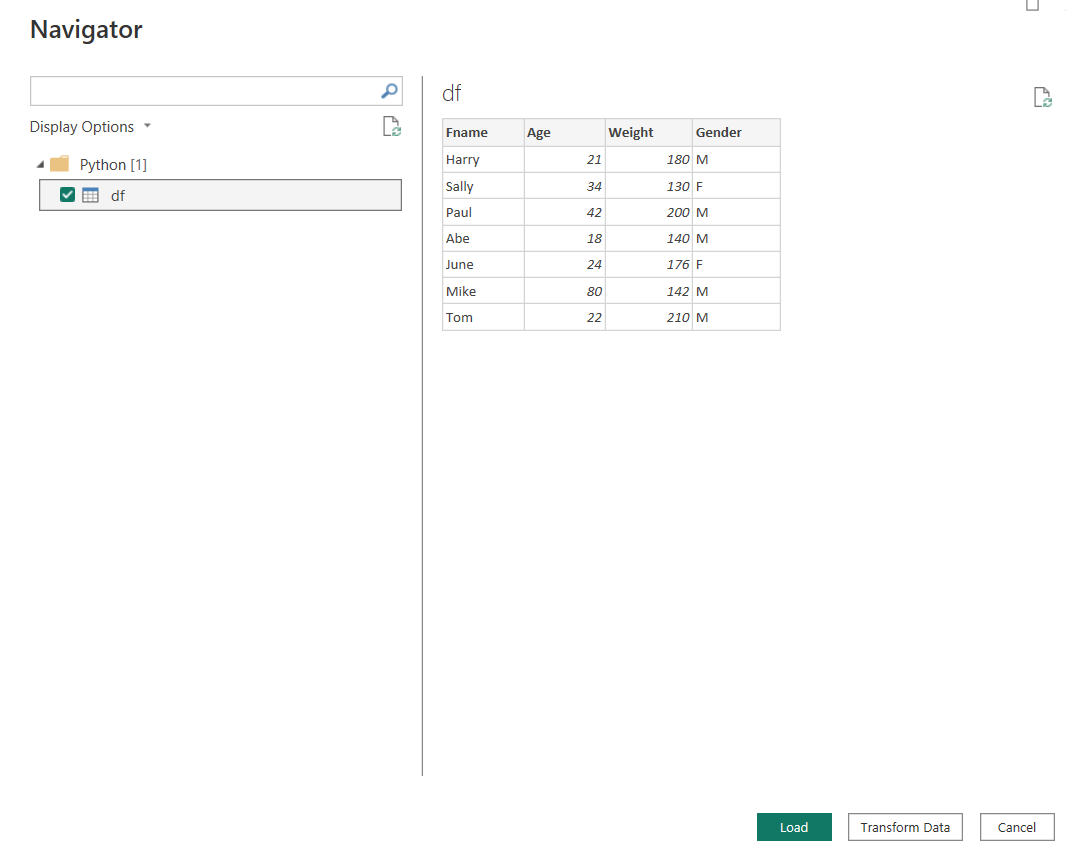
Successful connection looks like below:
If you get error like ‘ADO NET : Access Denied’ , it’s probably because either you have done something wrong in the options or you are using the Microsoft Store version of Power BI which I never recommend to use. (At least as of today.) 🤷♂️ Another error also could be because you have a missing library which you first need to install in R or Python.
Other issues than those, please post in the comments or mail me and let’s explore together. 😉🥸
When you hit the LOAD, you will see that Power BI put the data frame as a table on the Data section.
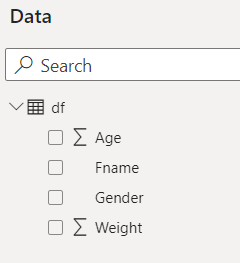
And you are done! 👍 You have just used Python and R to create a DATA SOURCE for Power BI!
Behind the Curtain
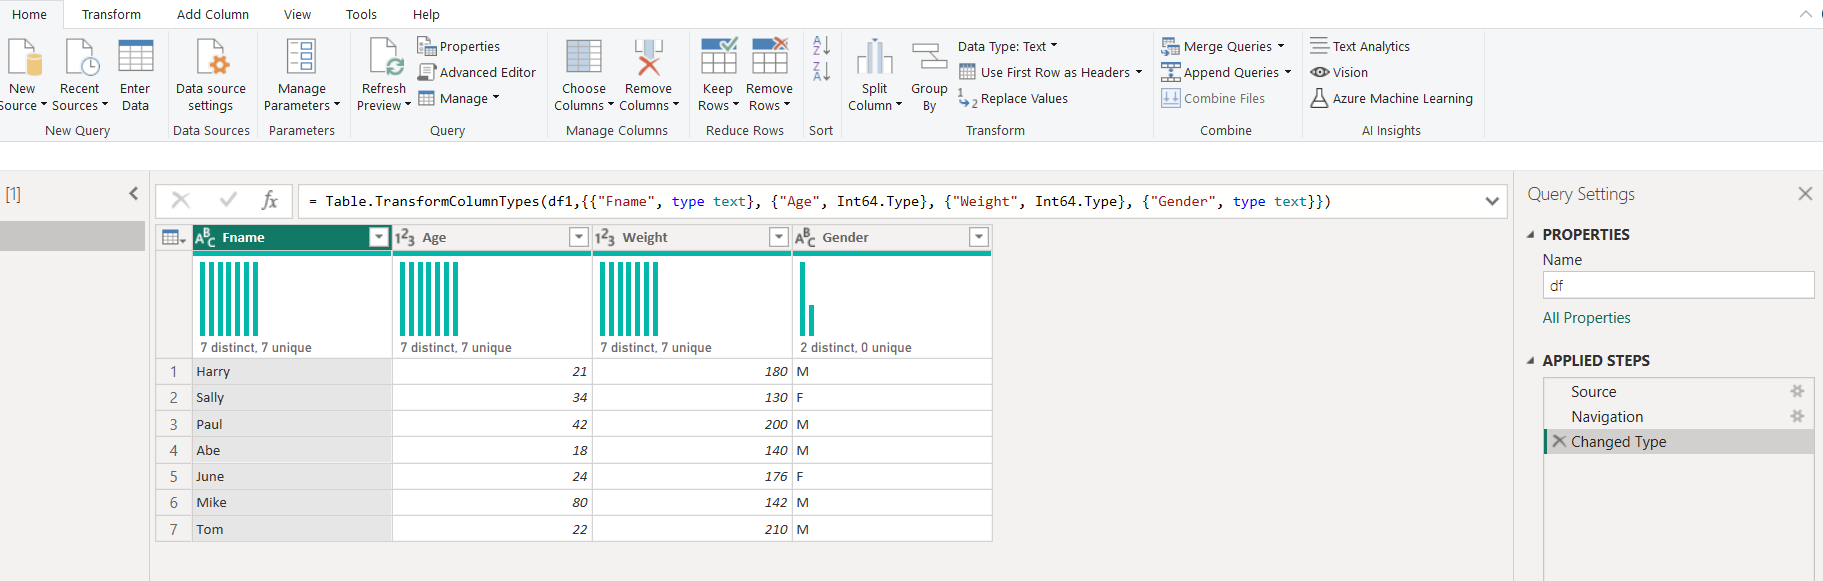
On the back end, to see what’s going on, just go to Transform Data and you will see Power BI added the data just like any other source in the query page.
However, you see the real magic when you go to Advanced Editor:
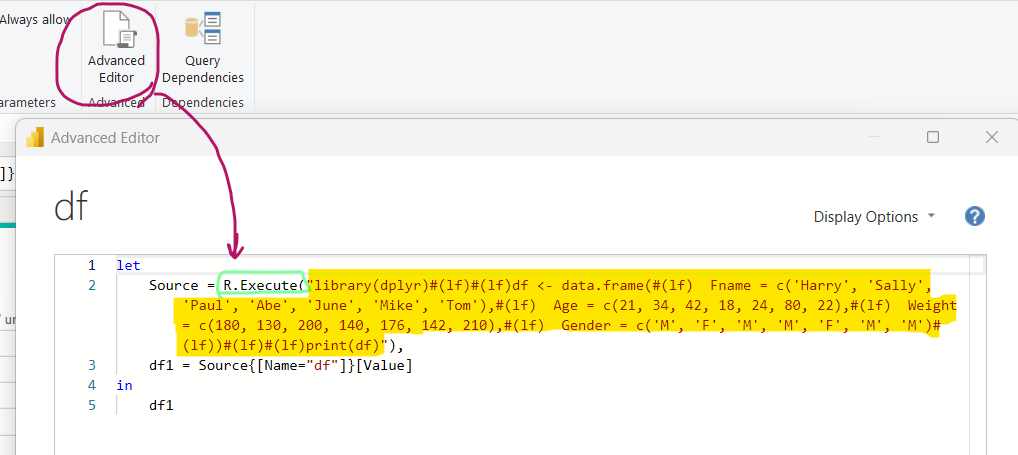
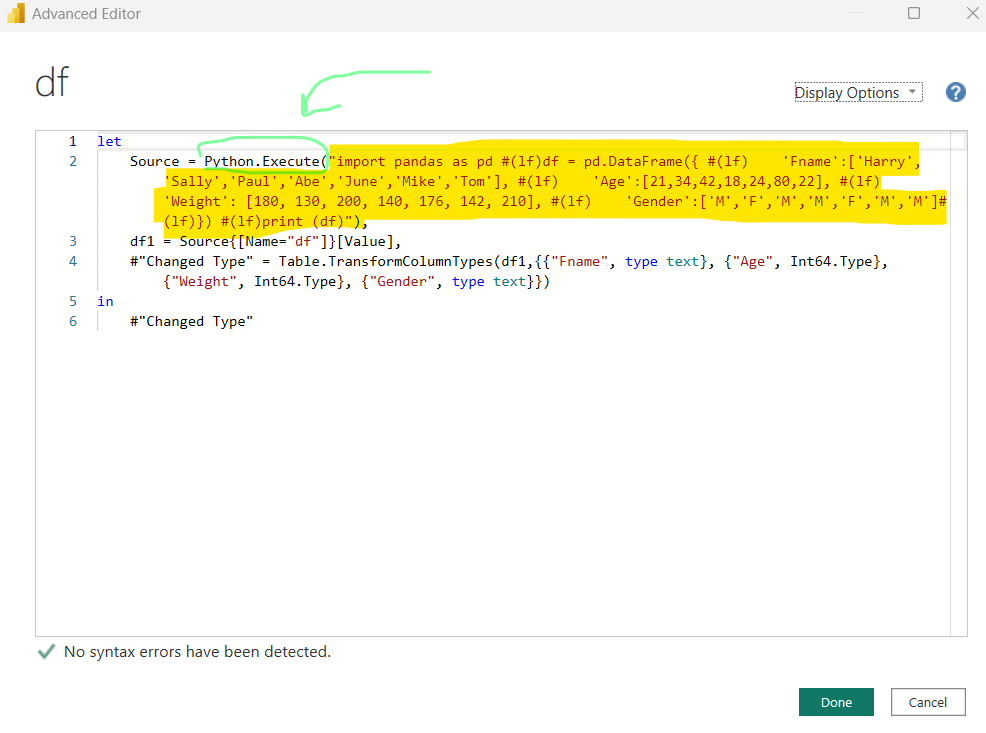
R.Execute and Python.Execute are the magician functions which enables this bridge between those tools! The rest is same old Power BI. 👾
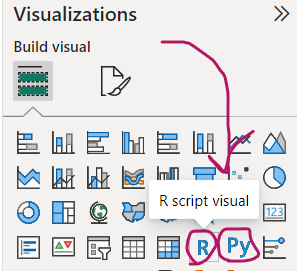
Using R or Python on “Report View” as a “Visual”
Now, let’s see how to add a visual by using these languages. For this, we choose one of the the below icons for R or Python:
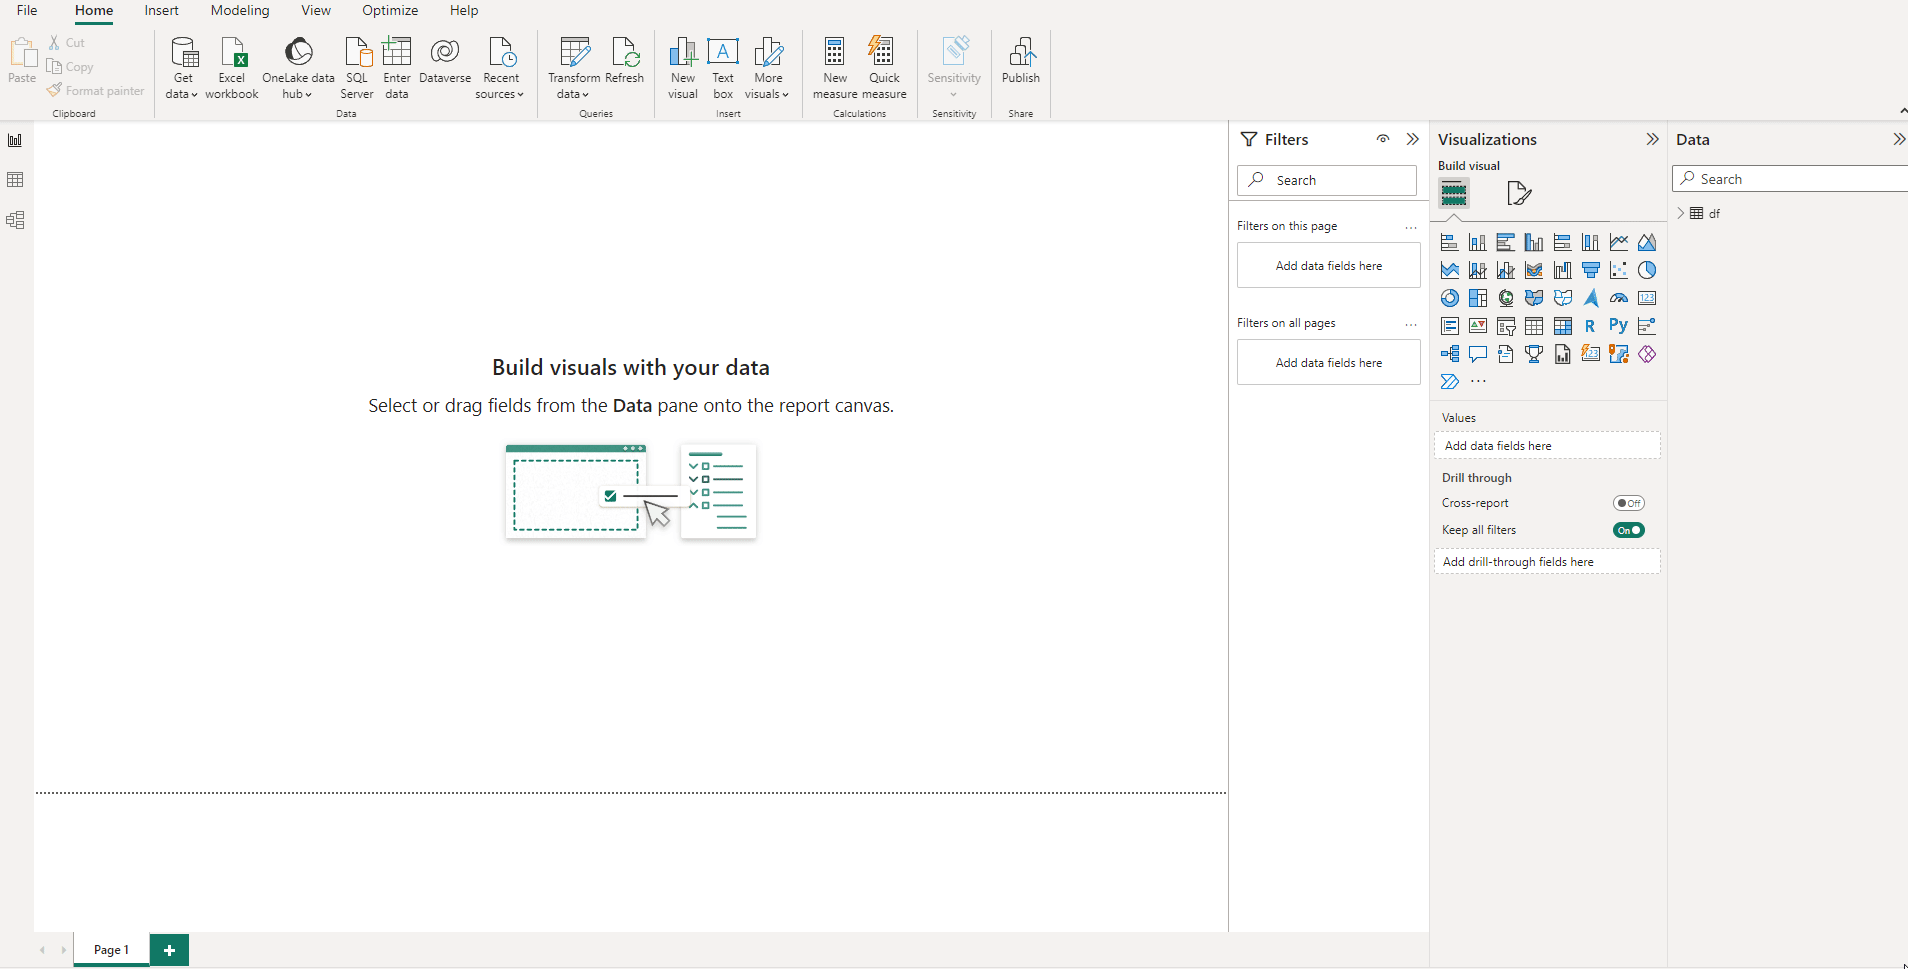
After you hit Enable, Power BI wants you to add some fields from your existing data. Even if you will not use it, you need to add at least one field to your code visual to enable scripting.
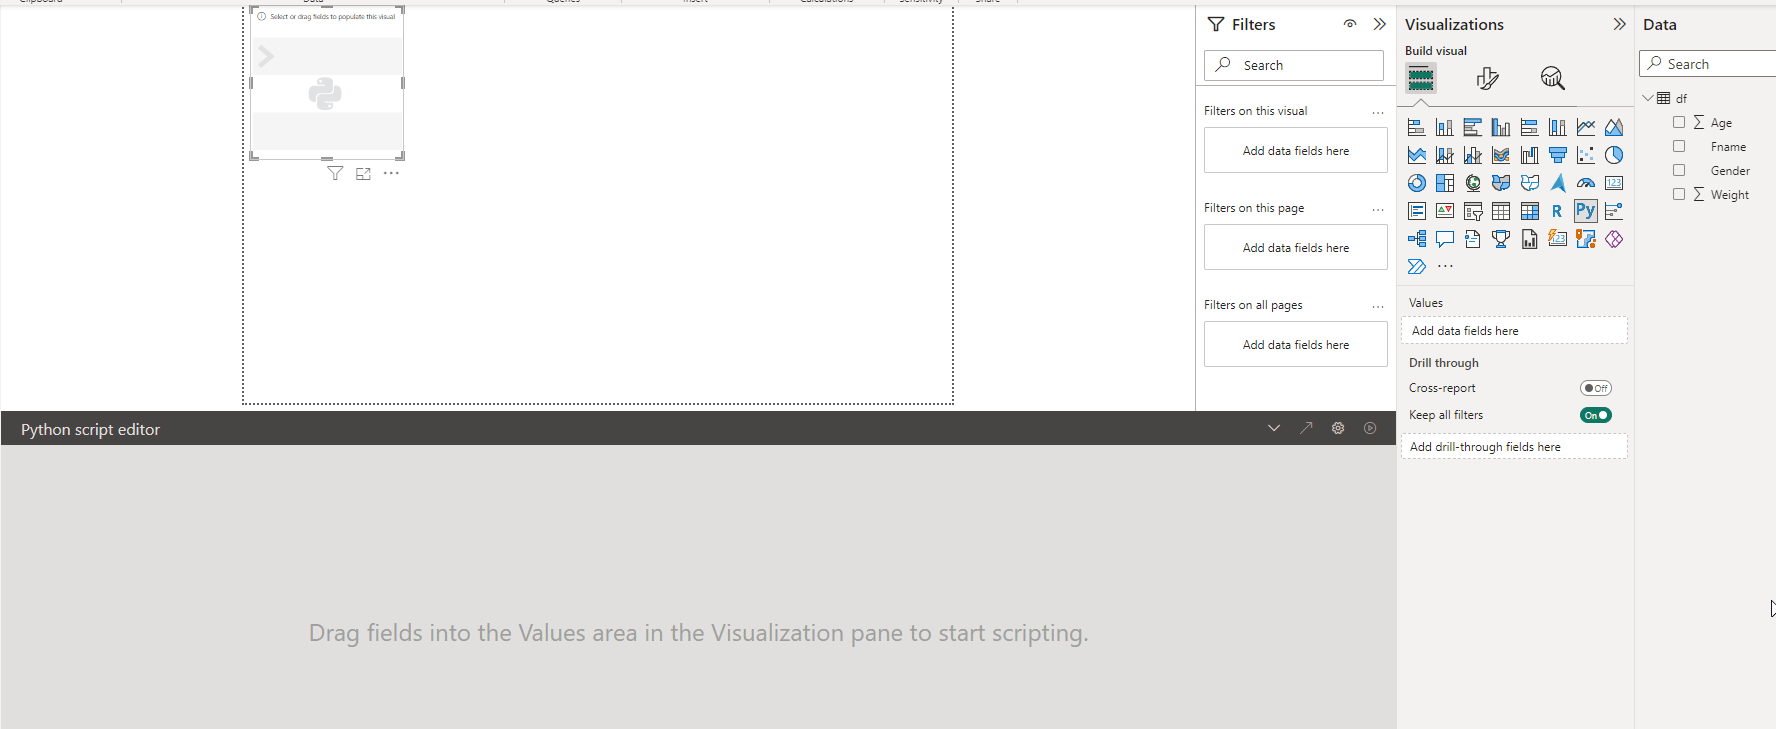
As you see, now you have the script editor open and ready to go!
To ensure reproducibility, we will generate our own data frames using Python and R and then visualize them. No need to worry, I’ve provided the code below for both Python and R. Simply copy and paste the following code for each respective language:
For Python:
import pandas as pd
import matplotlib.pyplot as plt

# Sample data
data = {
    'X': [1, 2, 3, 4, 5, 6, 7, 8, 9, 10],
    'Y': [3, 5, 4, 8, 7, 9, 6, 10, 12, 11]
}

# Create a DataFrame from the sample data
df = pd.DataFrame(data)

# Create a scatter plot using matplotlib
plt.scatter(df['X'], df['Y'], c='blue', label='Data Points')

# Show the legend
plt.legend()

# Display the plot (optional - needed when running outside Power BI)
plt.show()
For R:
# Sample data
data <- data.frame(
  X = c(1, 2, 3, 4, 5, 6, 7, 8, 9, 10),
  Y = c(3, 5, 4, 8, 7, 9, 6, 10, 12, 11)
)

# Create a scatter plot using R
plot(data$X, data$Y, col = 'blue', pch = 16)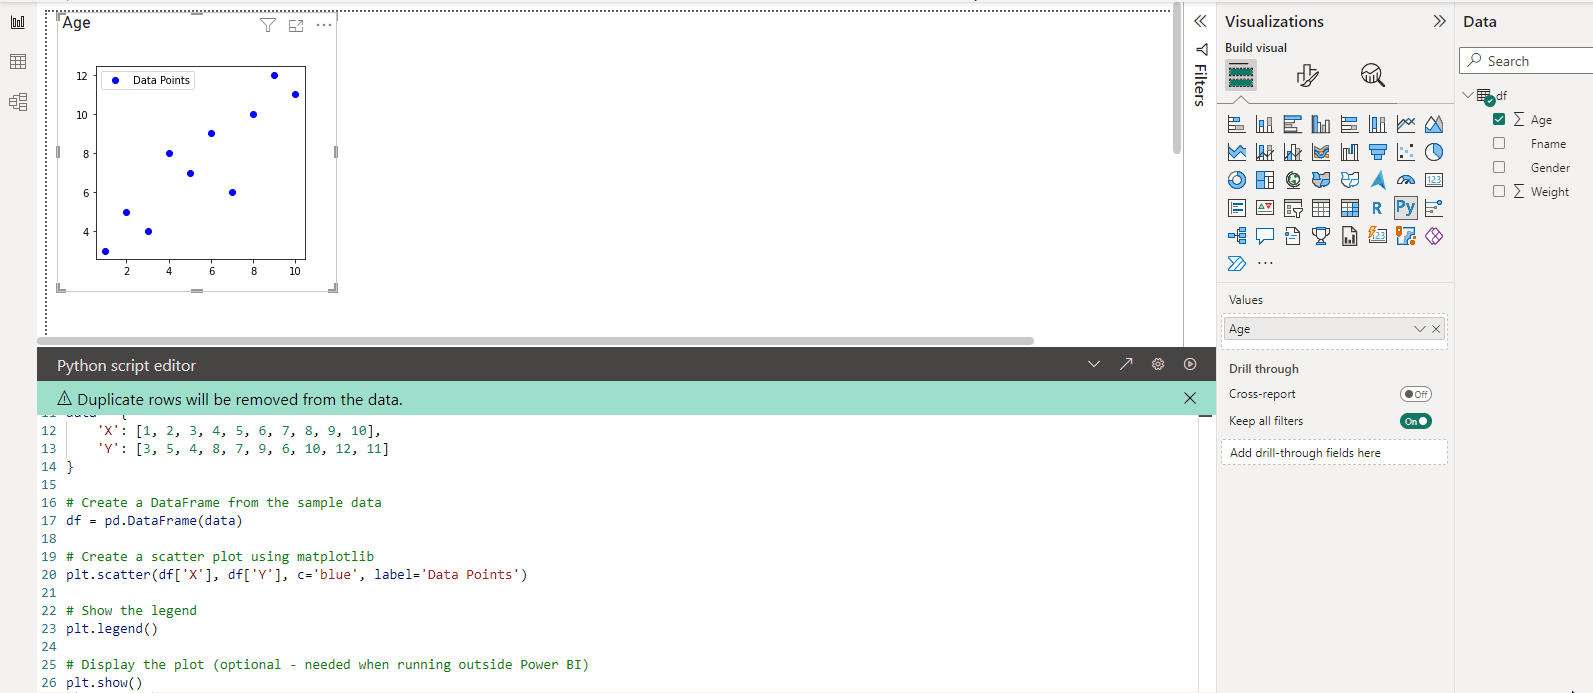
And that’s it! Now you know both how to use R an Python as a source in Power BI and also, as a visualization tool using a data source already added to power BI. After this point, it’s up to your imagination! 🖌️🤗
Some Tips from Experience
Always write your code in your IDE, because Power BI doesn’t have any help to you when you are doing the coding. It will just throw an error in any typos and it’s much harder to diagnose in Power BI than R Studio , PyCharm or VS Code!
Ask yourself which way is faster FOR YOU! IF you feel more confident in Python or R than coding in Power BI or if it just takes 5 minutes in Python and takes an hour to build the same thing in Power BI, just go with Python. Some people are faster in Python or R way more than solving query problems with M language.
I always believe this motto: “Choose the right tool for the job!”. If you are doing very complex data cleaning, outlier detection, detail calculations etc. , why bother yourself to push the Power BI to it’s limits? Didn’t you already see how it’s struggling to even load the things when the visuals and data gets complicated? Instead of trying hard to tune Power BI, just do it in already powerful languages like Python and R!
Focus more on Visuals in Power BI, focus more the backend in the rest! Power BI is a great dashboarding tool, maybe even the best out there currently. So, instead of focusing complex querying and adding computational load on that side to Power BI, you can choose already improved tools like R and Python. Yet, for example, if you are a R shiny developer and doing this only for dashboard creation, just don’t! Many tools already sitting in Power BI box for you! Also, maintaining and updating Power BI dashboards waaaay more easier than R Shiny!
Conclusion
I wanted to provide you with a head start and share some options based on my experience. Regardless, whether you are a Power BI developer, a Data Analyst, or a Data Scientist using Python or R, combining these tools offers tremendous potential!
I hope you enjoyed the article and feel free to add your comments below or mail me from the little envelope icon above!😉